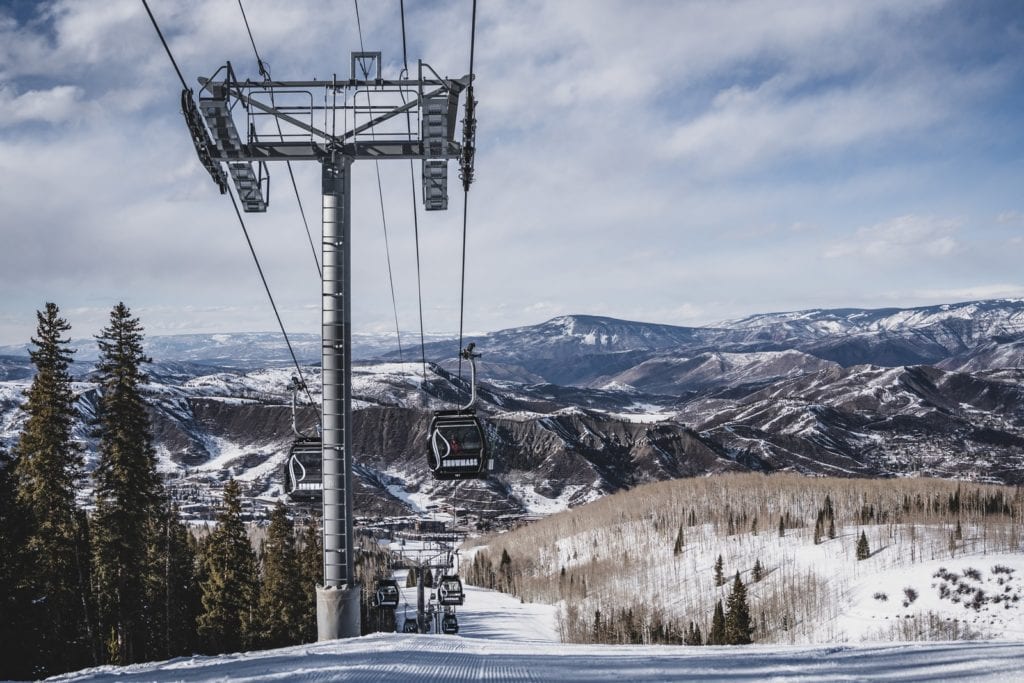
Living in a resort community offers a lifestyle second to none, with breathtaking views and world-class recreation, owners of properties in resort towns can attest to the benefits. The shift of consumers putting a premium on their lifestyle was evident in 2020, as resort real estate markets set new records in terms of increases in performance.
Summit Sotheby’s International Realty, in collaboration with LIV Sotheby’s International Realty and our other resort market affiliates, produces an annual Resort Report that specifically analyzes real estate market data for homes in resort locations, including Aspen, Jackson Hole, Big Sky, and Vail Valley. The results of this report made one thing clear, demand for a resort home dramatically increased last year compared to 2019. Across all locations, the total dollar volume sold increased notably, with many areas showing an increase of around 100%, year over year. An influx of buyers looking for their resort haven caused the average sales prices to increase, resulting in the rise of total dollar volume. Many areas also experienced a decrease in average days on market, showing that buyers were faced with increased competition and fewer days to make decisions.
The resort market is typically best defined as a second home market, but last year proved that many consumers were happy to call these locations their primary residence, especially given the flexibility and focus on lifestyle that was heightened by COVID-19.
Let’s take a look at how the Park City market has faired compared to Jackson Hole and Aspen.
For a more in-depth review of the market or to get a better understanding of how much your home might be worth in this strong market please don’t hesitate to reach out.
| Park City: | 2019 | 2020 | % Change |
| Average Sold Price: | $1,207,418 | $1,536,913 | 27.3% |
| Average Sold Price per Sq Foot: | $341 | $481 | 41.1% |
| Average Days on Market: | 100 | 94 | -6.0% |
| Highest Sold Price: | $32,500,000 | $20,000,000 | -38.5% |
| Lowest Sold Price: | $100,000 | $98,500 | -1.5% |
| Number of Properties Sold: | 1825 | 2426 | 32.9% |
| % Sold Price to Original List Price: | 96.2% | 97.2 | 1.0% |
| Total Dollar Volume Sold: | $2,203,537,006 | $3,728,551,137 | 69.2% |
| Jackson Hole: | 2019 | 2020 | % Change |
| Average Sold Price: | $1,702,076 | $2,720,558 | 59.8% |
| Average Sold Price per Sq Foot: | $782 | $937 | 19.8% |
| Average Days on Market: | 137 | 174 | 26.8% |
| Highest Sold Price: | $17,750,000 | $22,000,000 | 23.9% |
| Lowest Sold Price: | $281,000 | $331,000 | 17.8% |
| Number of Properties Sold: | 446 | 557 | 24.9% |
| % Sold Price to Original List Price: | 94.6% | 94.2% | -0.5% |
| Total Dollar Volume Sold: | $759,126,110 | $1,515,350,952 | 99.6% |
| Aspen: | 2019 | 2020 | % Change |
| Average Sold Price: | $4,414,112 | $7,237,713 | 64.0% |
| Average Sold Price per Sq Foot: | $1,545 | $1,882 | 21.8% |
| Average Days on Market: | 264 | 282 | 6.8% |
| Highest Sold Price: | $23,000,000 | $32,000,000 | 39.1% |
| Lowest Sold Price: | $345,000 | $425,000 | 23.2% |
| Number of Properties Sold: | 228 | 343 | 50.4% |
| % Sold Price to Original List Price: | 93.0% | 94.0% | 1.1% |
| Total Dollar Volume Sold: | $1,006,417,450 | $2,482,535,400 | 146.7% |


